Italian Americans by the Numbers: Definitions, Methods & Raw Data
Italian Americans by the Numbers: Definitions, Methods & Raw Data
(December 30, 2009)
The US Census Bureau collects scientific survey data on Italian Americans and other ethnic groups. This article is the eighth in the i-Italy series “Italian Americans by the Numbers” reporting the survey numbers for the period 2006-2008, and discussing their implications.


Introduction
Virtually everyone knows that the US Census Bureau conducts a census every ten years and is currently preparing for the 2010 census. Few people know the Census Bureau gathers scientific survey data about the US population annually called the American Community Survey (ACS).
The American Community Survey (ACS) is a nationwide scientific survey designed to provide a fresh look at how the American population is changing between the decade censuses. The ACS collects and produces population and housing information every year instead of every ten years. This data is published and periodically updated online as “The American Community Survey (ACS)” at the Bureau’s website www.census.gov/acs/www/.
Three-Year Estimates
The 2006-2008 ACS three-year estimates are based on data collected between January 2006 and December 2008. Published for selected geographic areas with populations of 20,000 or greater and representing the average characteristics over the 3-year period of time. Recently, ACS published data summarizing the years 2006-2008.
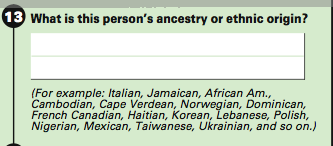
Part of the data collected describes “Ancestry Groups”. The individuals selected in the survey’s random sample are asked: “What is your ancestry or ethnic origin (For example Italian, Polish, Korean, etc)?” Aggregating the answers to these questions provides descriptive statistical characteristics for various ethnic groups. This "Italian Americans by the Numbers" series reports the numbers describing Italian Americans and comparing those numbers with the American population as a whole.
Part of the data collected describes “Ancestry Groups”. The individuals selected in the survey’s random sample are asked: “What is your ancestry or ethnic origin (For example Italian, Polish, Korean, etc)?” Aggregating the answers to these questions provides descriptive statistical characteristics for various ethnic groups. This "Italian Americans by the Numbers" series reports the numbers describing Italian Americans and comparing those numbers with the American population as a whole.
Because, there over 400 hundred spreadsheet lines in the census data file, I have been publishing the data on a ‘ piecemeal’ basis, in a series of articles under the general title “Italian Americans by the Numbers.” Each article has a sub-title indicating the specific characteristic(s) being described in that particular article.
The articles published thus far are as follows:
1. "Comparative ethnic populations and percentages"
http://www.i-italy.org/bloggers/10095/italian-americans-numbers-comparative-ethnic-population-totals-and-percentages
http://www.i-italy.org/bloggers/10095/italian-americans-numbers-comparative-ethnic-population-totals-and-percentages
2. "Where we Live"
http://www.i-italy.org/bloggers/10167/italian-americans-numbers-where-we-live
http://www.i-italy.org/bloggers/10167/italian-americans-numbers-where-we-live
3. "Age, Gender and Generations"
http://www.i-italy.org/bloggers/10313/italian-americans-numbers-age-gender-generations
http://www.i-italy.org/bloggers/10313/italian-americans-numbers-age-gender-generations
4. "Households, Marital Status, 'Mammonni' and "What does it mean to be Italian American?"
http://www.i-italy.org/bloggers/10502/title-italian-americans-numbers-households-marital-status-mammoni-and-what-does-it-me
http://www.i-italy.org/bloggers/10502/title-italian-americans-numbers-households-marital-status-mammoni-and-what-does-it-me
5. "Education -Who will educate our children?"
http://www.i-italy.org/bloggers/10718/italian-americans-numbers-education-who-will-educate-our-children
http://www.i-italy.org/bloggers/10718/italian-americans-numbers-education-who-will-educate-our-children
6. "Employment"
http://www.i-italy.org/bloggers/11262/italian-americans-numbers-employment
http://www.i-italy.org/bloggers/11262/italian-americans-numbers-employment
7. "Income, Earnings and Poverty"
http://www.i-italy.org/bloggers/11905/italian-americans-numbers-income-earnings-poverty
http://www.i-italy.org/bloggers/11905/italian-americans-numbers-income-earnings-poverty
Further, in each of the above articles, in an effort to facilitate comprehension and analysis, the data was formatted and edited with formulas, color coding, graphics, etc. The purpose of this article is to make available the complete unformatted data set in total and unedited. Also, in an effort to answer questions that has been asked regarding ethnic definitions and methods of data collection, I have placed extensive quotes from the section of the ACS site on methods and definitions.
……………..
METHODOLOGY
Because the ACS is a rigorously scientific sampling method intended to be representative of the population as a whole, the data collection method is very important. The following is from the ACS website.
“About the ACS: Housing Unit Data Collection
Mail
Several items are mailed to each sample household:
A prenotice letter to inform the residents of the sample address that they will receive an ACS questionnaire that should be completed and returned promptly. This letter includes information on the topics included in the survey and uses of the data.
An ACS questionnaire along with an instruction booklet, a Frequently Asked Questions brochure, a letter and a business reply return envelope.
A reminder postcard is sent a few days after the questionnaire is mailed to encourage the residents to complete the questionnaire or to thank them if they have already sent it.
A replacement questionnaire is mailed several weeks after the prenotice letter is mailed if the original questionnaire has not been returned.
Telephone
Approximately six weeks after the first ACS questionnaire is mailed, the Computer Assisted Telephone Interviewing (CATI) operation begins. Sample addresses that have not returned a completed paper questionnaire, and for which we have a telephone number will be called by Census Bureau telephone interviewing staff to complete the ACS interview over the phone.
Personal Visits
Following the CATI operation, a sample will be taken from the addresses for which we do not have a mail or CATI interview to conduct the Computer Assisted Personal Interviewing (CAPI) operation. Census Bureau field representatives visit these addresses to conduct the ACS interview in person
Two additional operations support HU data collection:
Telephone Questionnaire Assistance (TQA)
Respondents may call a toll free telephone number printed on the ACS questionnaire to obtain answers to general questions about the survey, to obtain help completing the paper questionnaire, or to complete the ACS interview over the phone.
Telephone Follow-up
The ACS questionnaire form has space to collect detailed information for five persons. For that reason, if the sample address has more than five residents, ACS staff will call to collect the detailed information for the additional persons and to obtain any other missing information.”
…………
RACE & ETHNICITY
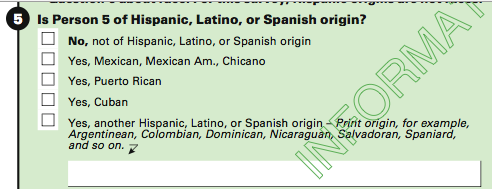
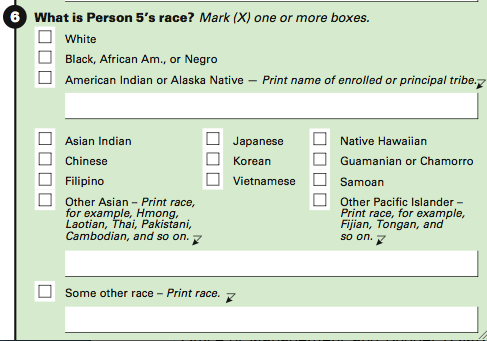
Questions about the meaning of ancestry and ethnicity are often asked. Basically, it is important to understand that the Census Department defines and differentiates: Race, Hispanic, and Ancestry. This distinction is best understood by looking at the three questions about those categories; copies of which will be provided below.
The following are definitions from the ACS website. Emphasizes in the form of bold italics have been added by me to some especially cogent points.
ETHNICITY
“Ethnic groups
There are two minimum categories for ethnicity: Hispanic or Latino and Not Hispanic or Latino. The federal government considers race and Hispanic origin to be two separate and distinct concepts. Hispanics and Latinos may be of any race.
Race and Ethnic Standards for Federal Statistics and Administrative Reporting
The Race and Ethnic standards were developed by the Office of Management and Budget in cooperation with Federal agencies to provide consistent data on race and ethnicity throughout the Federal Government. The development of the data standards stem in large measure from new responsibilities to enforce civil rights laws.
The categories are designed for collecting data on the race and ethnicity of broad population groups in this country. They are based on social and political considerations -- not anthropological or scientific ones. Furthermore, the race categories include both racial and national-origin groups.”
Hispanic
“ People who identify with the terms "Hispanic" or "Latino" are those who classify themselves in one of the specific Hispanic or Latino categories listed on the...ACS questionnaire—
Race
“Race is a self-identification data item in which respondents choose the race or races with which they most closely identify.
Ancestry
“Refers to a person's self-identification of heritage, ethnic origin, descent, or close identification to an ethnic group. Selected ancestry groups include Italian, Arab, Brazilian, Canadian, Czech, Irish, Russian, Subsaharan African, West Indian, etc.
.................
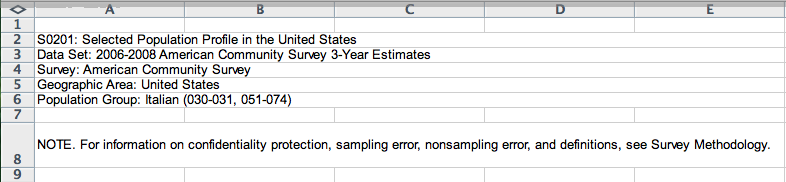
RAW DATA
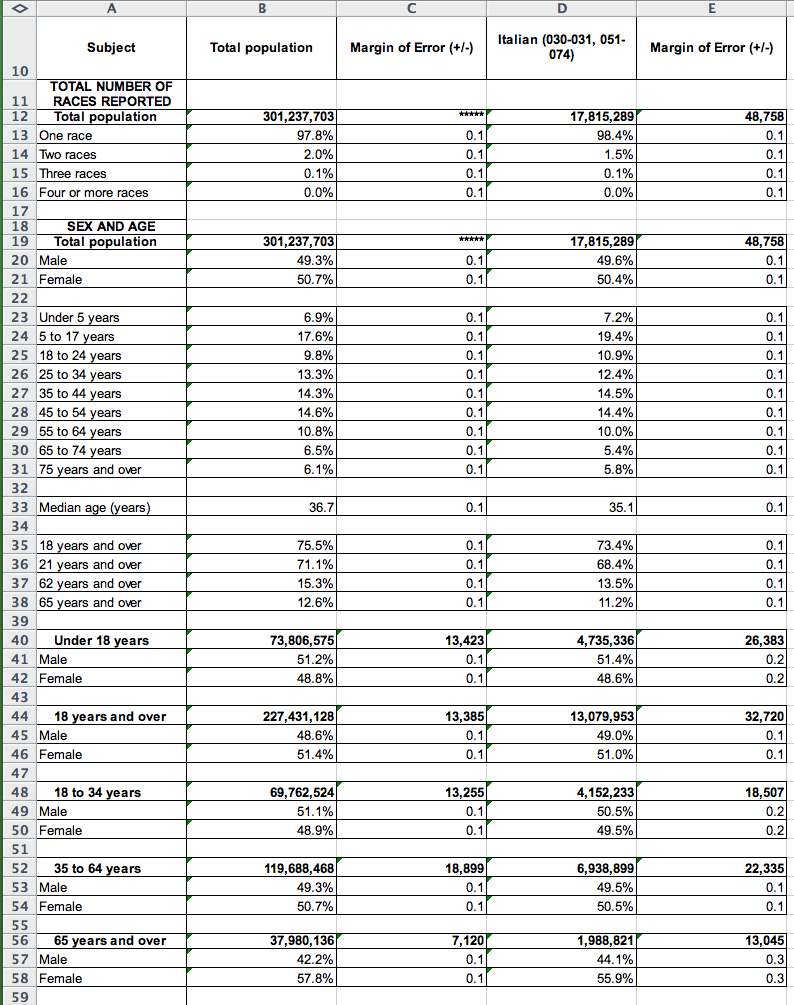
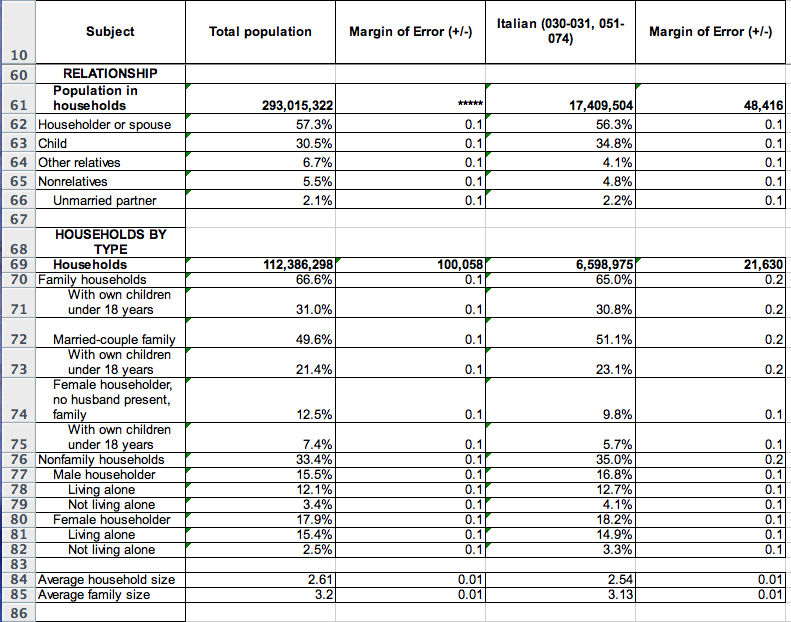
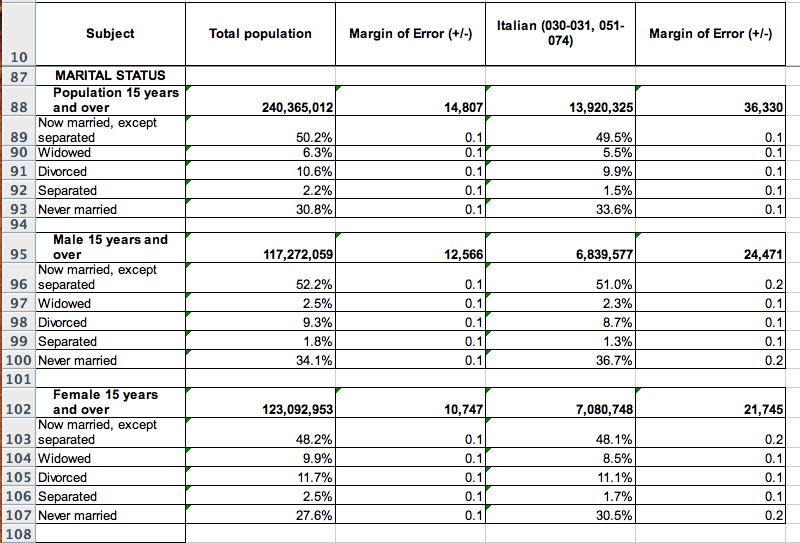
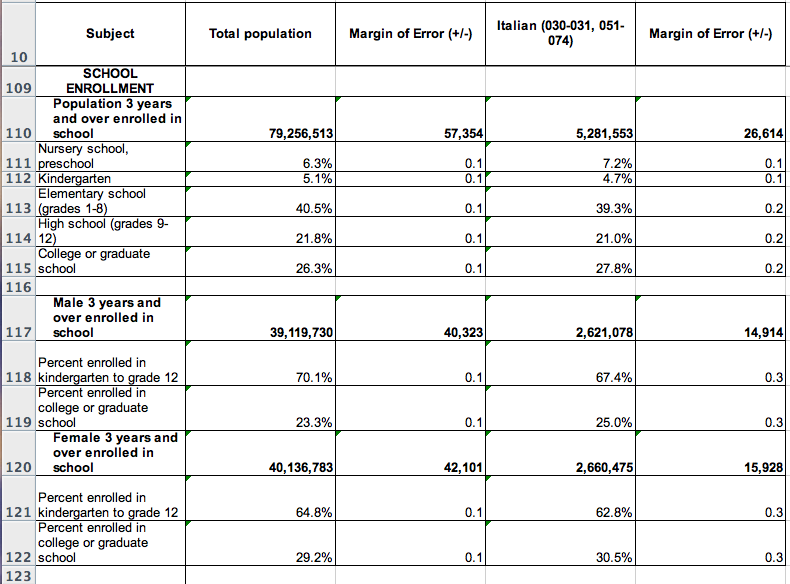
The data published on the Census Department’s web site can be ‘downloaded’ to a personal computer in the form of an Excel spreadsheet. I have ‘downloaded’ the data on the American population as a whole and “Americans of Italian Descent”. A copy of that 400+ line spreadsheet is presented below. Anyone wishing the original spreadsheet may send me an e-mail [email protected] and I will respond with the Excel spreadsheet as an attachment to your e-mail
AMERICAN COMMUNITY SURVEY
Below is a list of the population general descriptive categories and the line number on which they can be found in the raw data spreadsheet below the outline. Each general category in the data set is followed by lines of the measures of the category.
1 TOTAL NUMBER OF RACES REPORTED (line # 11)
2 SEX AND AGE (line # 18)
3 RELATIONSHIP (line # 60)
4 HOUSEHOLDS BY TYPE (line # 68)
5 MARITAL STATUS (line # 87)
6 SCHOOL ENROLLMENT (line # 109)
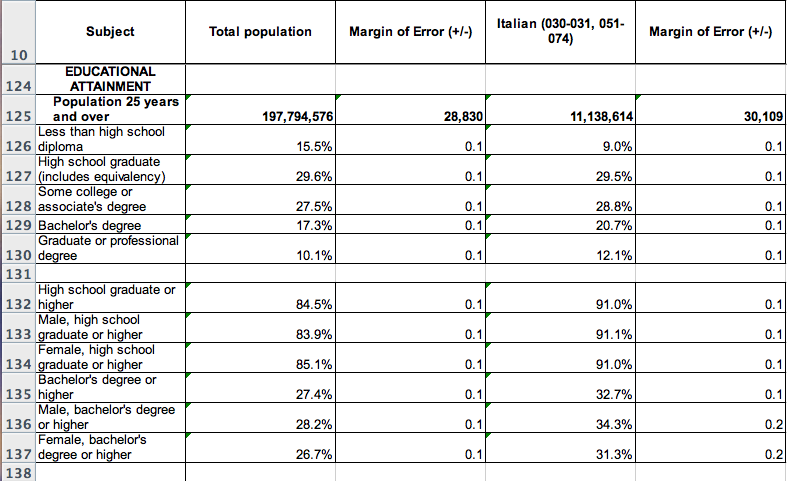
7 EDUCATIONAL ATTAINMENT (line # 124)
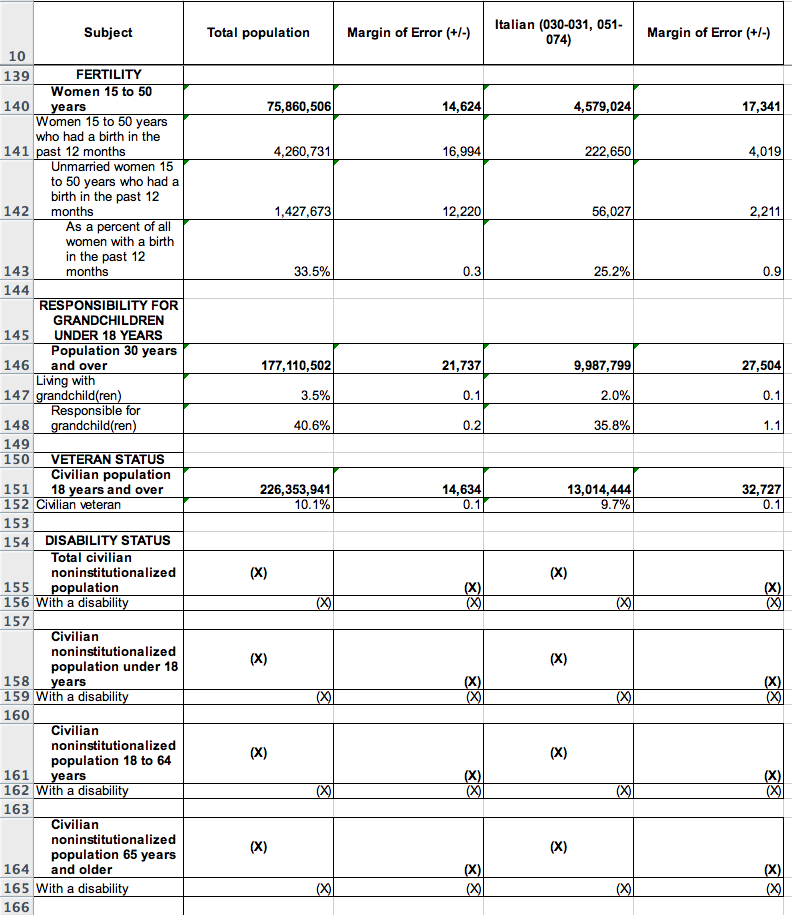
8 FERTILITY (line # 139)
9 RESPONSIBILITY FOR GRANDCHILDREN UNDER 18 YEARS (line # 145)
10 VETERAN STATUS (line # 150)
11 DISABILITY STATUS (line # 154)
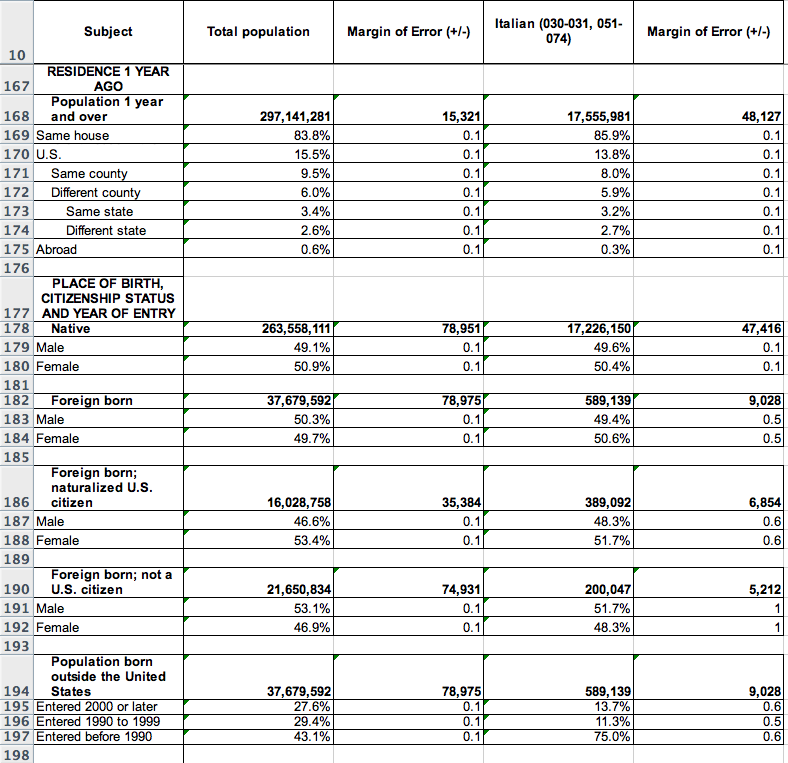
12 RESIDENCE 1 YEAR AGO (line # 167)
13 PLACE OF BIRTH, CITIZENSHIP STATUS AND YEAR OF ENTRY
(line # 177)
(line # 177)
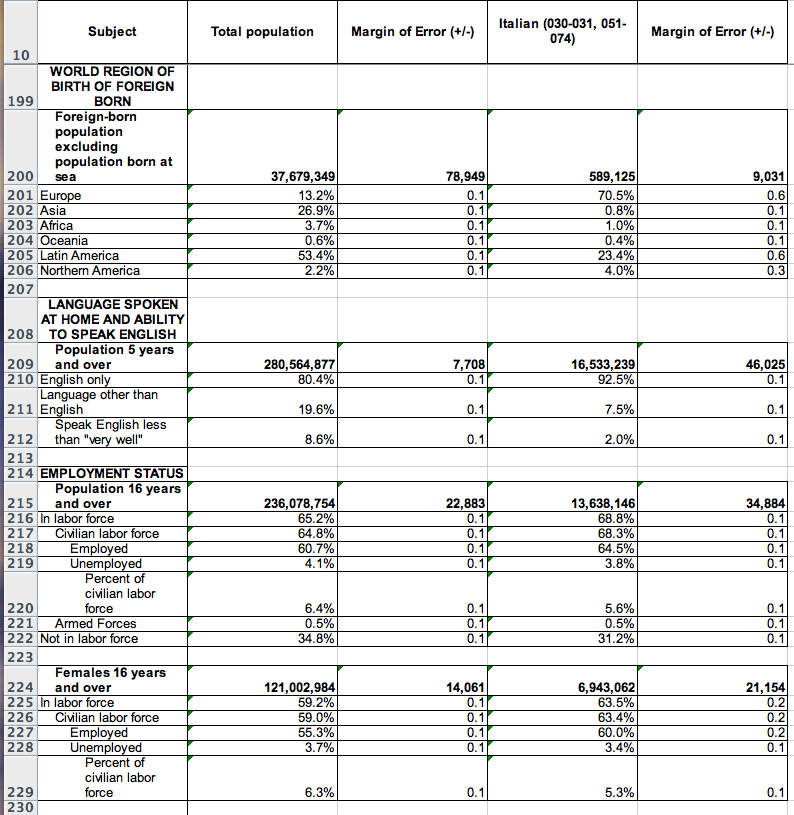
14 WORLD REGION OF BIRTH OF FOREIGN BORN (line # 199)
15 LANGUAGE SPOKEN AT HOME AND ABILITY TO SPEAK ENGLISH
(line # 208)
(line # 208)
16 EMPLOYMENT STATUS (line # 214)
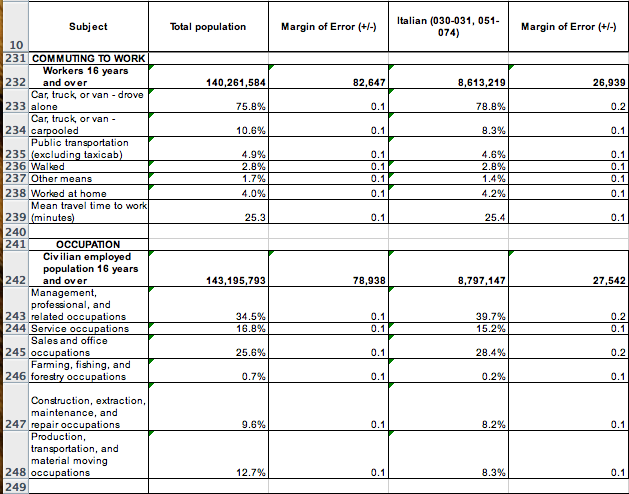
17 COMMUTING TO WORK (line # 231)
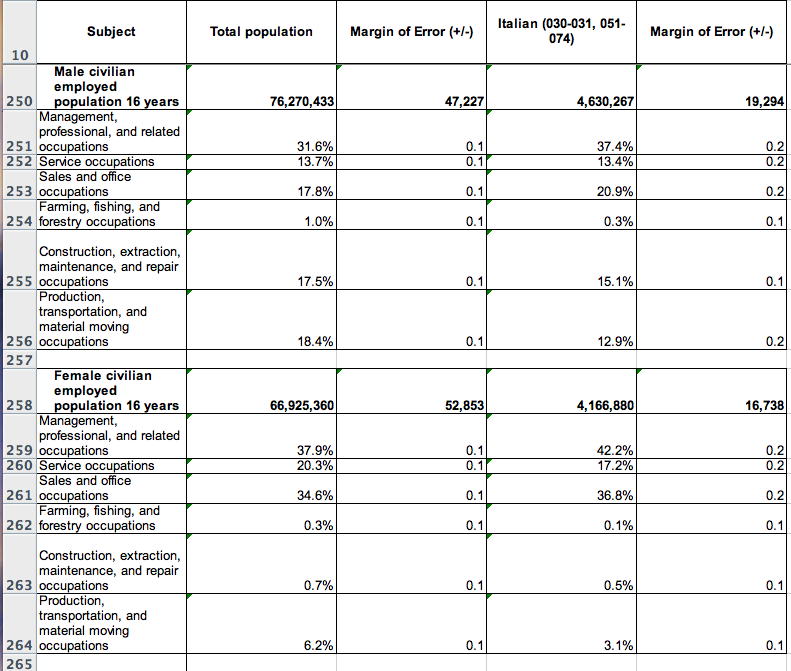
18 OCCUPATION (line # 241)
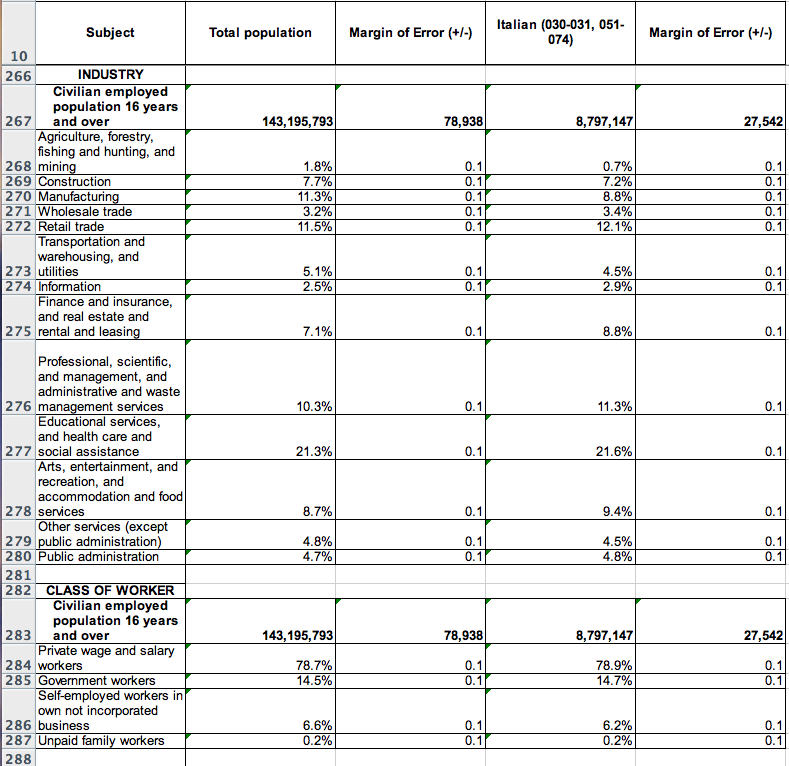
19 INDUSTRY (line # 266)
20 CLASS OF WORKER (line # 282)
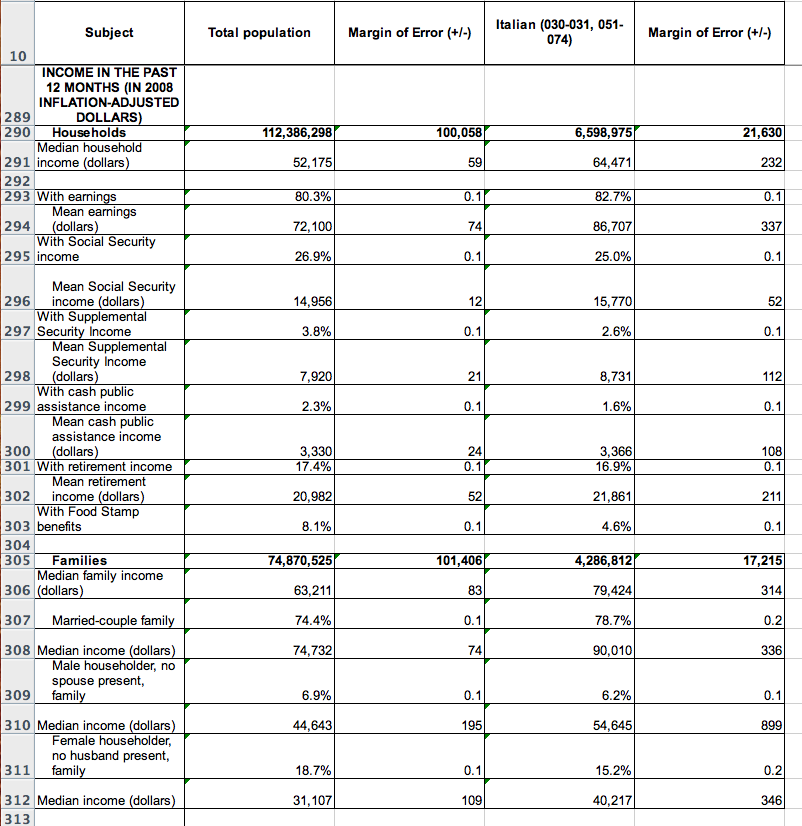
21 INCOME IN THE PAST 12 MONTHS (IN 2008 INFLATION-
ADJUSTED DOLLARS) (line # 289)
ADJUSTED DOLLARS) (line # 289)
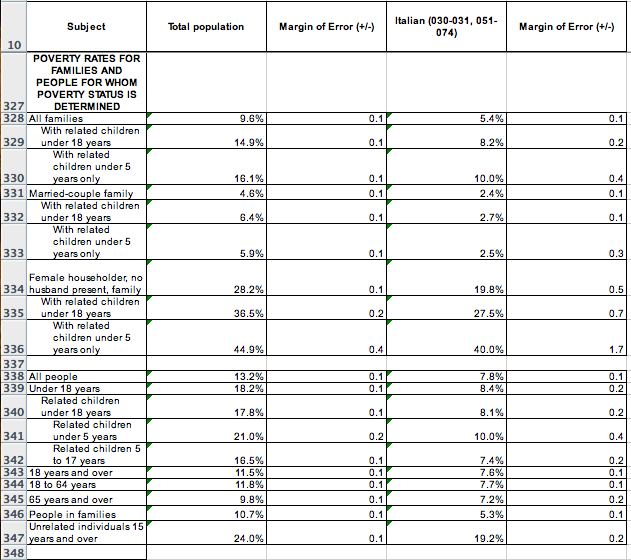
22 POVERTY RATES FOR FAMILIES AND PEOPLE FOR WHOM
POVERTY STATUS IS DETERMINED (line # 327)
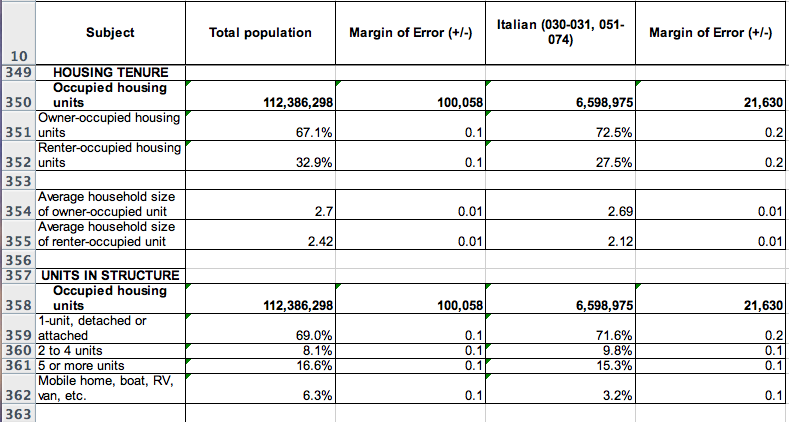
23 HOUSING TENURE (line # 349)
24 UNITS IN STRUCTURE (line # 357)
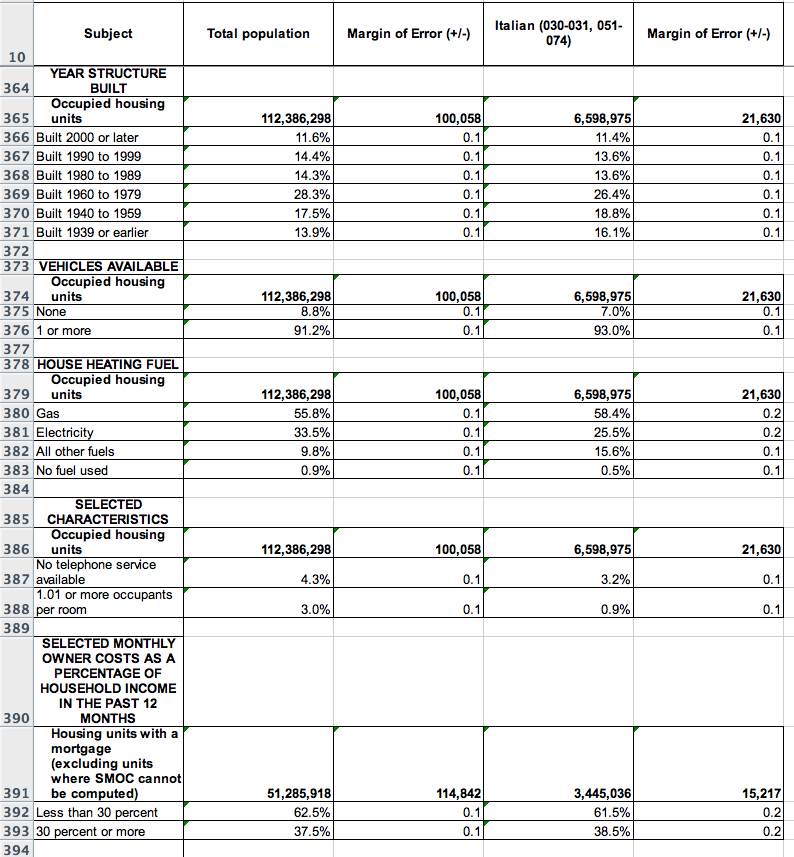
25 YEAR STRUCTURE BUILT (line # 364)
26 VEHICLES AVAILABLE (line # 373)
27 HOUSE HEATING FUEL (line # 378)
28 SELECTED CHARACTERISTICS (line # 385)
29 SELECTED MONTHLY OWNER COSTS AS A PERCENTAGE OF
HOUSEHOLD INCOME IN THE PAST 12 MONTHS (line # 390)
HOUSEHOLD INCOME IN THE PAST 12 MONTHS (line # 390)
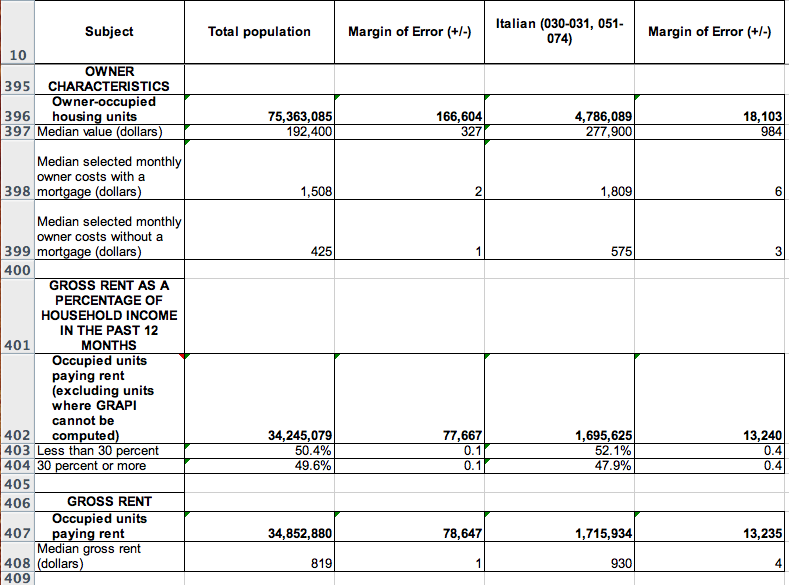
30 OWNER CHARACTERISTICS (line # 395)
31 GROSS RENT AS A PERCENTAGE OF HOUSEHOLD INCOME
IN THE PAST 12 MONTHS (line # 401)
32 GROSS RENT (line # 406)
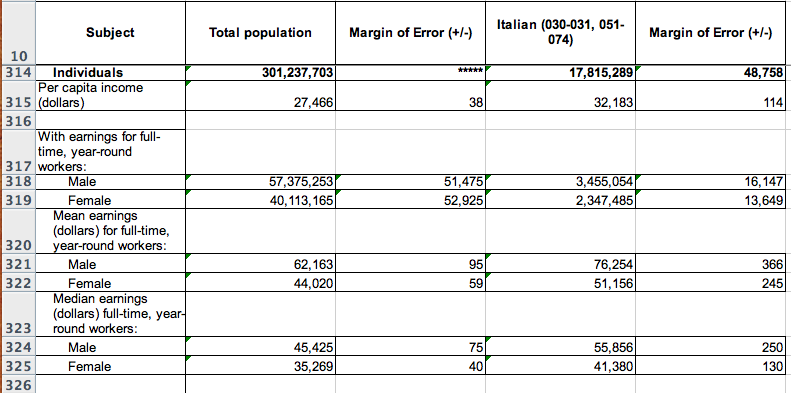
Source: U.S. Census Bureau, 2006-2008 American Community Survey
Data are based on a sample and are subject to sampling variability. The degree of uncertainty for an estimate arising from sampling variability is represented through the use of a margin of error. The value shown here is the 90 percent margin of error. The margin of error can be interpreted roughly as providing a 90 percent probability that the interval defined by the estimate minus the margin of error and the estimate plus the margin of error (the lower and upper confidence bounds) contains the true value. In addition to sampling variability, the ACS estimates are subject to nonsampling error (for a discussion of nonsampling variability, see Accuracy of the Data). The effect of nonsampling error is not represented in these tables.
Notes:
·Data for the households, families, occupied housing units, owner-occupied housing units, and renter-occupied housing units lines refer to the specified race, Hispanic or Latino, American Indian or Alaska Native, or ancestry of the householder shown in the table. Data in the "Total population" column are shown regardless of the race, Hispanic or Latino, American Indian or Alaska Native, or ancestry of the person.
·The Census Bureau introduced a new set of disability questions in the 2008 ACS questionnaire. Because of contextual differences between the 2008 disability data and disability data collected in the previous two years, the Census Bureau is unable to combine the 3 years of disability data in order to produce the multi-year estimate that would appear in this table. Multi-year estimates of disability status will become available once three consecutive years of data are collected. For more information about the differences between the 2008 and prior year's disability questions, and the evaluation of these questions in the 2006 ACS Content Test, see the Evaluation Report Covering Disability.
·Occupation codes are 4-digit codes and are based on Standard Occupational Classification 2000.
·Industry codes are 4-digit codes and are based on the North American Industry Classification System 2002 and 2007. The 2006 and 2007 ACS data are coded using NAICS 2002 while the 2008 ACS data use NAICS 2007 codes. Categories that differ between 2002 and 2007 NAICS are aggregated so that the 3 years of data are consistent in display and reflect the NAICS 2007 codes. The Industry categories adhere to the guidelines issued in Clarification Memorandum No. 2, "NAICS Alternate Aggregation Structure for Use By U.S. Statistical Agencies," issued by the Office of Management and Budget.
·Due to the use of value categories rather than specific amounts collected for each individual housing unit in 2006 and 2007, property value on the 3-year file cannot be inflation adjusted. Any table providing data on property values is reported in current dollars. This is in contrast to the other monetary data on the 3-year file, which are inflated to 2008 dollars.
·The estimate for median selected monthly owner costs with a mortgage, median selected monthly owner costs without a mortgage, and median gross rent for previous years is adjusted for inflation to the current year.
·See the Glossary for more information on the definition of the following population groups: Arab, Arab/Arabic, European, Subsaharan African, African, American, and All Other Hispanic or Latino.
·While the 2008 American Community Survey (ACS) data generally reflect the November 2007 Office of Management and Budget (OMB) definitions of metropolitan and micropolitan statistical areas; in certain instances the names, codes, and boundaries of the principal cities shown in ACS tables may differ from the OMB definitions due to differences in the effective dates of the geographic entities. The 2008 Puerto Rico Community Survey (PRCS) data generally reflect the November 2007 Office of Management and Budget (OMB) definitions of metropolitan and micropolitan statistical areas; in certain instances the names, codes, and boundaries of the principal cities shown in PRCS tables may differ from the OMB definitions due to differences in the effective dates of the geographic entities.
·Estimates of urban and rural population, housing units, and characteristics reflect boundaries of urban areas defined based on Census 2000 data. Boundaries for urban areas have not been updated since Census 2000. As a result, data for urban and rural areas from the ACS do not necessarily reflect the results of ongoing urbanization.
Explanation of Symbols:
1. An '**' entry in the margin of error column indicates that either no sample observations or too few sample observations were available to compute a standard error and thus the margin of error. A statistical test is not appropriate.
2. An '-' entry in the estimate column indicates that either no sample observations or too few sample observations were available to compute an estimate, or a ratio of medians cannot be calculated because one or both of the median estimates falls in the lowest interval or upper interval of an open-ended distribution.
3. An '-' following a median estimate means the median falls in the lowest interval of an open-ended distribution.
4. An '+' following a median estimate means the median falls in the upper interval of an open-ended distribution.
5. An '***' entry in the margin of error column indicates that the median falls in the lowest interval or upper interval of an open-ended distribution. A statistical test is not appropriate.
6. An '*****' entry in the margin of error column indicates that the estimate is controlled. A statistical test for sampling variability is not appropriate.
7. An 'N' entry in the estimate and margin of error columns indicates that data for this geographic area cannot be displayed because the number of sample cases is too small.
8. An '(X)' means that the estimate is not applicable or not available.
DISCLAIMER: Posts published in i-Italy are intended to stimulate a debate in the Italian and Italian-American Community and sometimes deal with controversial issues. The Editors are not responsible for, nor necessarily in agreement with the views presented by individual contributors.
© ALL RIGHTS RESERVED - RIPRODUZIONE VIETATA.This work may not be reproduced, in whole or in part, without prior written permission.
Questo lavoro non può essere riprodotto, in tutto o in parte, senza permesso scritto.
Add a comment
-
This Blog
-
ABOUT THE AUTHOR
Most Commented
