Italian Americans by the Numbers – Employment
Italian Americans by the Numbers – Employment
(October 2, 2009)
Window of Italian-American Employment Agency. Note jobs: “Italian Bus Boy”, “Italian and Wife Artichokes Ranch”
“The Italian-Americans are so far removed in time, space and attitude from their heritage that they could safely drop the hyphenate form. They are Americans, period, [although] somewhat confused and confusing ethnic pride.”
VESPERS by Ed McBain (AKA Salvatore Albert Lombino)


 Series Preface


This blog series, “Italian Americans by the Numbers”, presents demographic data about Italian Americans based on the US Census Departments “2005-2007 American Community Survey (ACS)”. “The ACS collects and produces population and housing information every year instead of every ten years. The 2005-2007 ACS three-year estimates are based on data collected between January 2005 and December 2007.”
For a more detailed introduction to the ACS, please see the first article in this series “Italian Americans by the Numbers - Comparative ethnic population totals and percentages” located at
i-Italy.org – Bloggers– “South of Rome West of Ellis Island”
or click on the link in this article.
If there are any questions, comments or requests, please place them in the comments section below and/or write to me directly at [email protected]. (If you place a note in the comments section, please send a copy to my e-mail address. The auto response system of the comment section may not notify me.)
Summary of Series Reports to date:
1. “Comparative ethnic population totals and percentages”
2. “Where we live”
3. “Age, Gender & Generations”
4 “Households, Marital Status, “Mammoni” and “What does it mean to be Italian American?”
5. “Education: Who will educate our children”
To view these reports, click on links in this report.
Introduction
There are three types of information contained in these reports:
1. Descriptive Measures (quantities and percentages) of the American population in general.
2. Descriptive Measures (quantities and percentages) of Americans who identified themselves as of Italian descent.
3. Comparative Measures (percentages) of Americans generally and Americans of Italian descent.
“Comparative percentages” provide us with a measure of similarities and differences between the American population in general and Italian American population, thereby helping us understand who we are.
“Comparative Absolute Values”
Further, I attempt to quantify and make more objective the relative similarities and differences between the two populations. The technique I use is called “Absolute Value”. The absolute value of a number is the number without plus or minus signs. Thus, for example, the absolute value of a +3 is 3 and the absolute value of a -3 is also 3.
Removing the plus and minus signs makes it possible to compute average differences for many measures. For a more detailed explanation of how I understand the mathematical concept of absolute value and how it is used in these reports, please see the Discussion Section at the end of this report.
Emphasis: my understanding of absolute value and its application is based on decades old recall of freshman college algebra, Needless to say: anyone who thinks my math erroneous or my logic fallacious, or has any other questions or comments, PLEASE advise via my above e-mail address! Thank you.
------------
American Community Survey Employment statistics are presented here in five tables:
I. Employment Status
II. Occupation
III. Industry
IV. Class of Worker
V. Commuting to Work
Experience has taught me that people who have little or no experience with quantitative methods generally and data presented in matrix form (columns & rows) tend to get “glassy eyed” when presented with spreadsheets. Accordingly, in an effort to facilitate understanding, I use two pedagogic tools.
First, I present an outline of the information that appears in the spreadsheet. The outline has no numeric values. Most are familiar with outlines and hopefully, once comfortable with the outline, the transition to the spreadsheet will be facilitated.
Second, there are two types of quantitative values in the tables: (1) numbers which have been ‘given’ in the Census and (2) numbers which have been computed. Once ‘given’ measures by the Census, ‘analysis’ is done by ‘computation’.
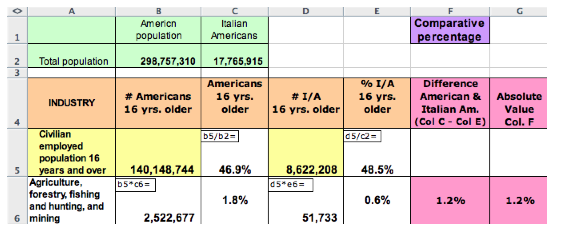
In the tables that follow, I have place, what I call, ‘computation boxes’ showing how the computed number was arrived at. For example, in an illustrated table segment below: The number in ‘cell’ column B row 2 (298,757,310) is ‘given’ by the Census Dept. It represents the total number of Americans. Similarly, the number in cell B5 (140,148,744) is ‘given’ and represents the number of “Americans 16 years and older” who are ‘Civilian employed”
Moving to cell C5, the number in that cell is 46.9% is ‘computed’, as indicated in the ‘computation box’ in the upper left-hand corner, by dividing the number in cell b5 by the number in cell b2 (i.e. 140,148,744 / 298,757,310 and converting decimal to % format).
Note: all the numbers in columns F and G are computed, as indicated in there headings (F4 and G4), so there is no need for ‘computation boxes’ in those cells.
Analysis (computation) is intended to increase our understanding of the population. Thus, comparing the numbers of ‘Americans civilian employed’ (B5) with the number of ‘Italian Americans civilian employed’ (D5) becomes more meaningful when we compute and compare the percentages C5 and E5.
//////////////////////
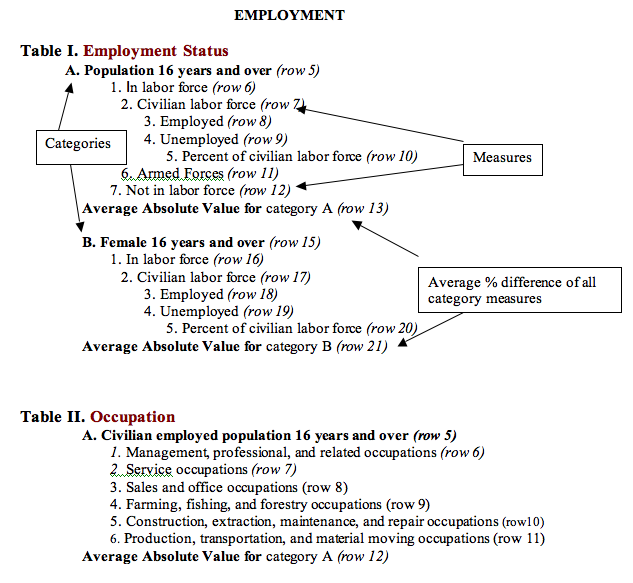
In outline form the five tables look like the following.
Each Table is divided into ‘Categories’ (Outline Capital letters A, B, etc.) and each category is divided into ‘Measures’ (Outline Numbers 1, 2, etc.).
The ‘average absolute value’ allows for comparisons of Americans in general with Italian Americans in each ‘category’.
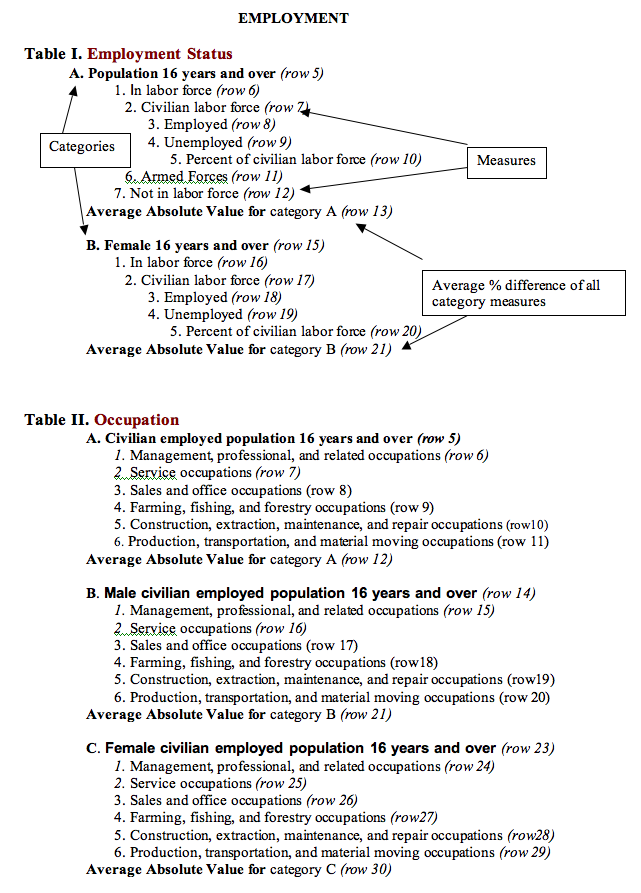

Table I. Employment Status
Discussion Table I
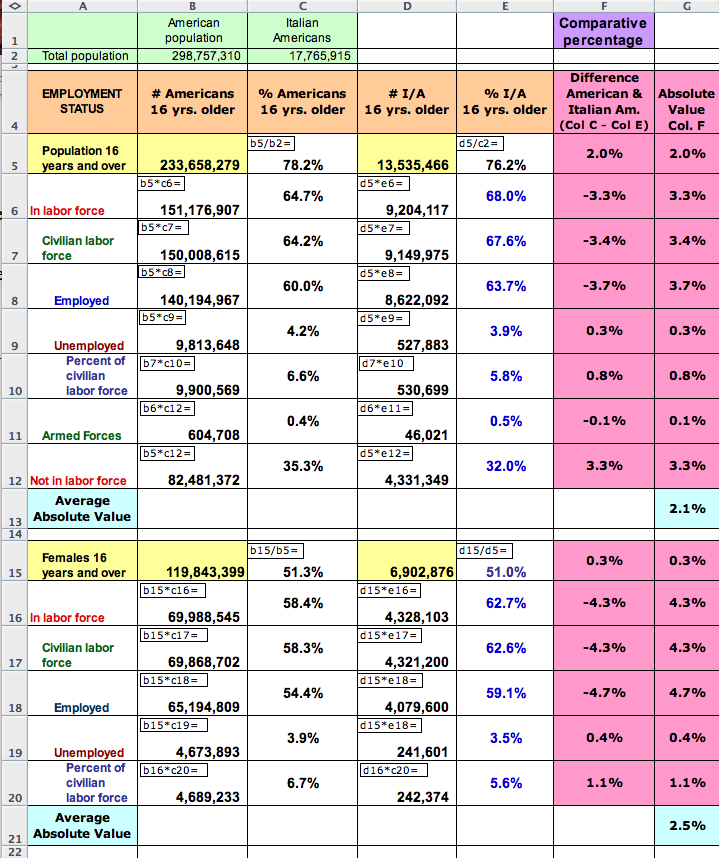
Measures of “Employment Status” are divided into two Categories: ‘Population 16 years and older’(rows 5- 13) and ‘Females 16 years and older’(rows 15- 21).
Column F Row 5 indicates that the percentage of the Italian American population ‘16 years and over’ is slightly less that than the percentage of the total American population ‘16 years and over’ (i.e. 78.2% - 76.2% = 2.0%).
Note: a positive number in Column F indicates that the Italian American percentage is larger and a negative number indicates that the Italian American percentage is smaller.
In the Category ‘Population 16 years and older’ (rows 5- 13), Italian Americans on a percentage basis have a larger presences ‘In labor force’ (F6); a larger percentage ‘Employed’ (F 8) and a smaller percentage ‘Unemployed’ (F9).
In the Category ‘Females 16 years and older’(rows 15- 21), Italian American women on a percentage basis have a larger presences ‘In labor force’ (F16); a larger percentage ‘Employed’ (F 18) and a smaller percentage ‘Unemployed’ (F19).
The Average Absolute Value of all the Measures in both Categories respectively 2.1% (G13) and 2.5% (G21) do not seem significant, and we can conclude that that Italian American Measures of Employment Status are virtually the same as the American population as a whole
Note: all the numbers in column G are positive. Therefore, the Average Absolute Value does not indicate larger or smaller only amount of difference.
Table II. Occupation
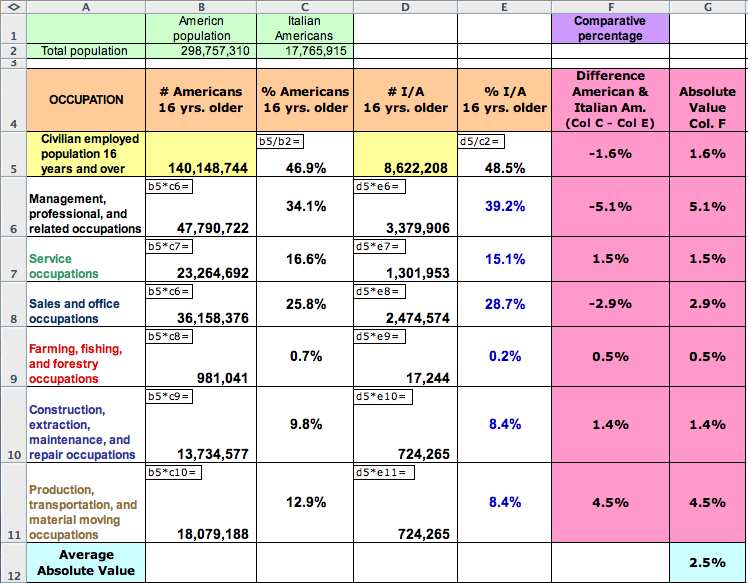
Table II. Occupation
B. Male civilian employed population 16 years and over
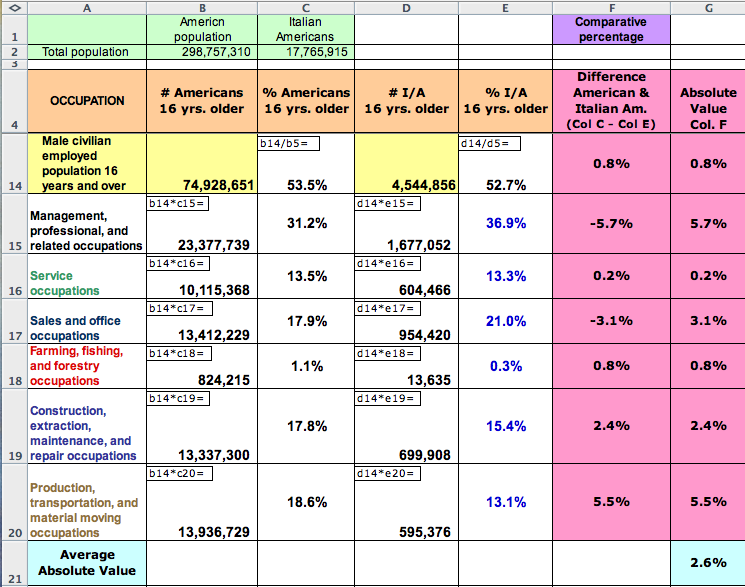
Table II. Occupation
Discussion Table II Occupation
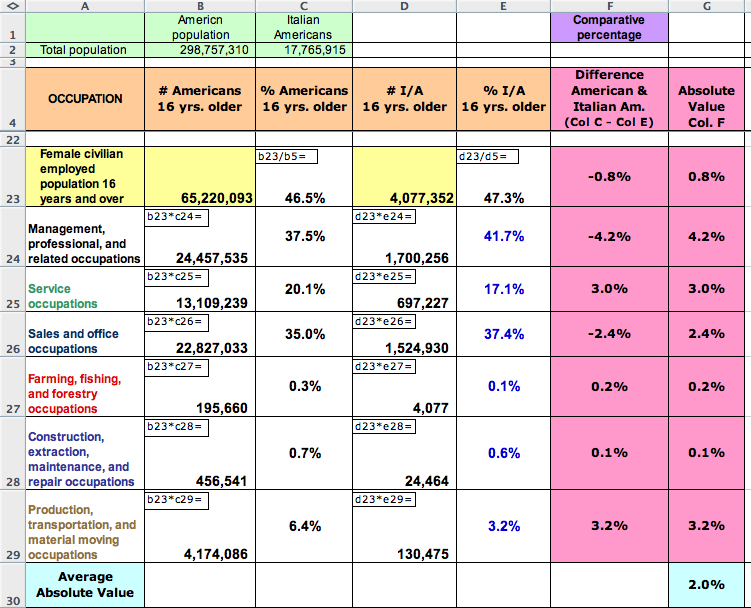
Measures of “Occupations” are divided into three Categories: ‘Civilian employed population 16 years and over’ (rows 5-12), ‘Male civilian employed population 16 years and over’ (row 14-21)and ‘Female civilian employed population 16 years and over’(row 23-30).
Again, there is not a great deal of difference between the Italian American population and the American population as a whole. The typical Italian American worker is very much like the typical American worker. This typicality is indicated by the Average Absolute Value numbers for all three Categories: 2.5% (G12), 2.6% (G21), 2.0% (G30) respectively.
However, note the difference for the measure ‘Management, professional, and related occupations’ in all three categories -5.1% (F6), -5.7% (F15) and -4.2 (F24). In all three categories, Italian Americans show a higher percentage representation in Management and professions. Whether the percentage difference would be considered ‘statistically significant’ would require mathematical analysis. However, percentage differences in the 5% range are more than most of the measures we have seen in this study so far.
Table III. Industry
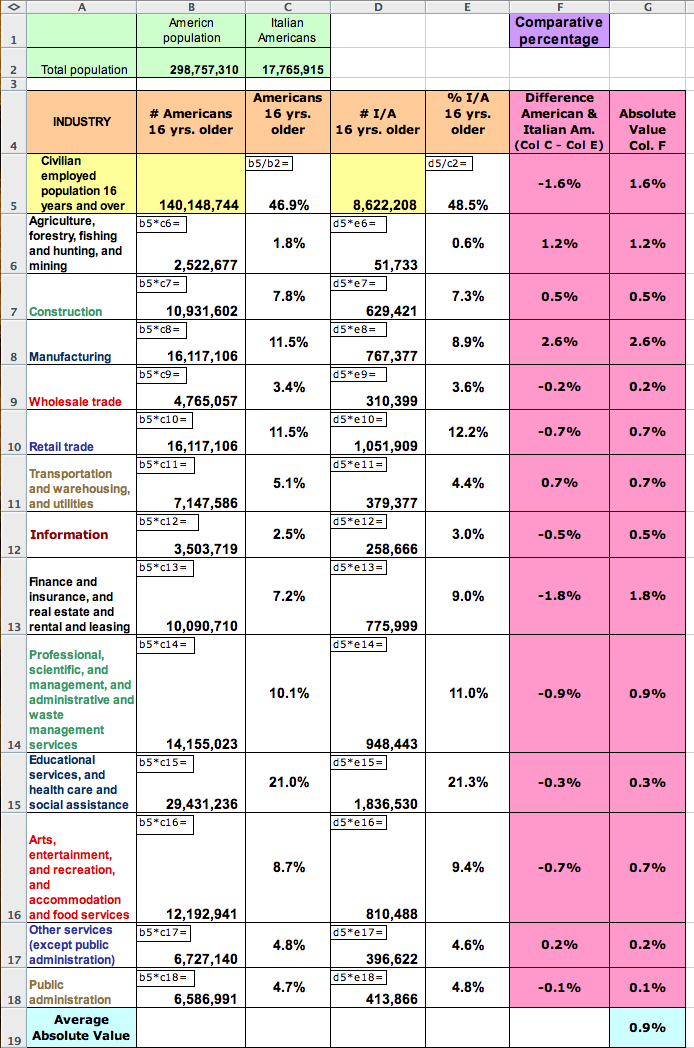
Discussion Table III Industry
Measures of “Industry” are present in one Category ‘Civilian employed population 16 years and over’ (rows 5-19).
Again, there is not a great deal of difference between the Italian American population and the American population as a whole as clearly indicated by the Average Absolute Value 0.9% (G19).
Table IV.Class of Worker
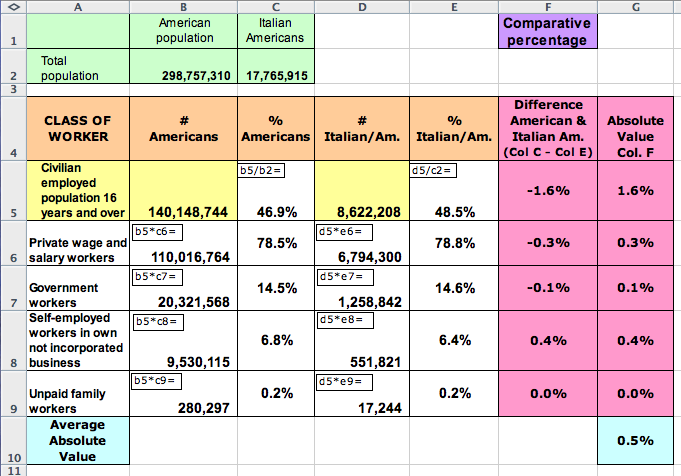
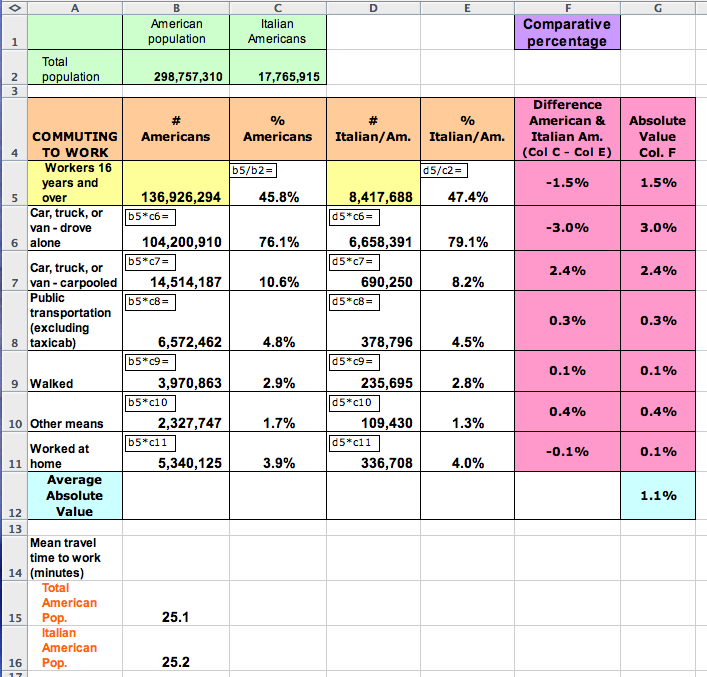
Table V.Commuting to Work
Summary discussion
1. What does it mean to be an Italian American?
In terms of employment the typical Italian American is very much the typical American. This is the same conclusion that the previous five demographic studies in this series has shown.
So far there is nothing in the quantitative measures of the Census Dept. studies that defines what it means to be an Italian American. Is Savatore Lomino (Ed McBain) correct when he writes:
“The Italian-Americans are so far removed in time, space and attitude from their heritage in Naples or Palermo that they could safely drop the hyphenate form. There are Americans, period, [although] somewhat confused and confusing ethnic pride.”These are kids whose great-great-grandparents came here as immigrants at the turn of the century. Kids whose great-grandparents were first-generation Americans. Kids whose grandparents fought against Italy in World War II, whose parents were teenagers in the Sixties, and who themselves are now teenagers who do not speak Italians and who do not care to learn, thank you. They are Americans. " VESPERS (Avon Books 1990; p 80-81)
2. Absolute Value (general discussion)
I’ve suggested that the absolute values of percent differences between two populations is a method of comparing the similarities and differences between the Italian American population the Total American population.
What follows is my understanding of my very old and dusty ‘college algebra’ textbook. I present it not to instruct; rather, to make clear my thinking.
Two values shown in the graph below are +3 and -3. Both represent distance from zero (0). The plus sign (+) indicates direction (i.e. to the right of zero). The minus sign (-) indicates direction (i.e. to the left of zero). The plus and minus signs indicate direction but not distance.
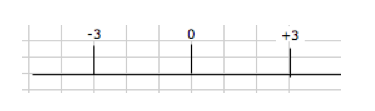
However, regardless of direction to the left or right, both distances are equal. Both are three units from zero. For example, think of two people standing on a street corner and the street corner is point zero (0). If one person travels 3 miles west (think to the right of zero) from a street corner and the other persons travel 3 miles east (think to the left of zero) from the corner, then both would have traveled the same distance, i.e. 3 miles, albeit in different directions.
To compute the average distance travel by both people, one has no choice but to use absolute values. To compute the average, add the two numbers and divide by 2. If one adds +3 and -3 the sum is zero. Zero divided by 2 equals zero. Obviously, the average distance traveled in this example is not zero.
Using absolute value: 3+3=6, 6/2=3. The average distance traveled by the two people is 3 miles. Which is obviously true.
Similarly, in the census tables above, when comparing the % of population numbers of the ‘total American population’ and the ‘Italian American population’, I subtract the Italian American population % from the Total American population %. Accordingly, if the ‘Italian American %’ is larger than the ‘Total American’ then the difference will be a negative %. Using the absolute values of the differences, gives a measure of the difference between the two populations in the measured category.
Again, anyone who thinks my math erroneous or my logic fallacious, PLEASE advise through e-mail [email protected]. The comments section’s notification process is inconsistent. E-mail assures that I will get your response. Thank you
DISCLAIMER: Posts published in i-Italy are intended to stimulate a debate in the Italian and Italian-American Community and sometimes deal with controversial issues. The Editors are not responsible for, nor necessarily in agreement with the views presented by individual contributors.
© ALL RIGHTS RESERVED - RIPRODUZIONE VIETATA.This work may not be reproduced, in whole or in part, without prior written permission.
Questo lavoro non può essere riprodotto, in tutto o in parte, senza permesso scritto.
Add a comment
-
This Blog
-
ABOUT THE AUTHOR
Most Commented
